


We’ve added the following statistics to your dashboard (https://m.my-bnb.com):-
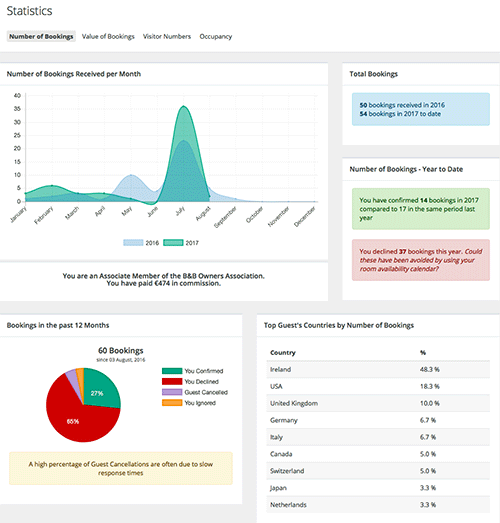
- Graph: Number of bookings received per MONTH v previous YEAR
- Pie Chart: Number of bookings confirmed, declined, ignored or cancelled over previous 12 months
- List: % Nationality or Country of guests
- Coloured Box: Summary of bookings
- Graph: Value of Booking received by MONTH v previous YEAR
- Pie Chart: Value of bookings confirmed, declined, ignored or cancelled over previous 12 months
- List: Top Guest’s Countries by Booking Value
- Coloured Box: Summary of the value of bookings today
- Graphs: Showing monthly and annual visitors to your webpage/website in the past 4 years.
- List: Top websites directing visitors to your webpage/website
- Pie Charts: Number of Guests per booking and number of nights per booking
- List: Time between Booking & Arrival
- Graph: Month booking received v month of arrival
We hope this information will help with your online marketing – it will help determine the “sweet spot” when you can increase your room rates to match demand.
AS well as good performance these stats will highlight bad performance – there are a few things we can do to help and we can advise on how you can help yourself but on a local level, demand is generated by awareness and/or need.
The network of websites operated by the B&B Owners Association belongs to you the members – help us help you by linking to or mentioning our websites to your guests. https://book-a-bnb.com/#view-websites